
The Headline
Canada's economy grew 0.5% in April 2026, the best monthly reading in over a year. [1] After a quarter of stagnation and months of soft numbers, the headline looked like a turning point.
It was disproportionately fossil fuels. Mining, quarrying, and oil and gas extraction grew 2.9%, the sector's largest monthly increase since February 2024. Oil and gas extraction specifically rose 3.7%. Oil sands output surged 6.6%, rebounding from scheduled maintenance shutdowns earlier in the year. [1] The fossil fuel chain extended further: pipeline transportation rose 2.6% (crude oil pipelines up 4.8%), petroleum and coal product manufacturing jumped 5.8%, and rail transportation gained 3.8% on broad-based commodity freight. [1]
A rough decomposition using sector weight and growth rate: mining, quarrying, and oil and gas extraction, at roughly 5% of GDP in chained 2017 dollars, contributed an estimated 0.15 to 0.20 percentage points of the 0.5% headline. Add the downstream chain and the fossil fuel economy accounted for a substantial share of total growth. Strip it out and April GDP grew closer to 0.30%. (StatCan publishes a formal contribution chart in the same release; this estimate is an author calculation for illustration.) [1]
This followed a first quarter in which GDP was flat after contracting 0.2% in Q4 2025. Business capital investment fell for a fifth consecutive quarter. Services industry incomes were, in Statistics Canada's phrasing, "generally flat." The household savings rate dropped to 3.5%, the lowest since Q1 2024. [2] The advance estimate for May was already down to 0.1%. [1]
If oil is driving the headline, the conventional model says the Canadian dollar should be rising. It is not. The loonie sat at approximately US$0.705 at end of June 2026, a 14-month low. [19] That is the paradox this article unpacks.
The Break
Alberta Central, the liquidity and advocacy organization for Alberta's credit unions, published an econometric analysis titled "The Canadian dollar: A petro-currency no more" that quantified what currency traders had been observing for years. [6]
The regression modelled changes in the USD/CAD exchange rate against four variables: changes in energy commodity prices, non-energy commodity prices, the Canada-U.S. interest rate differential, and the lagged dependent variable. Run across the 1997–2014 window, the energy price coefficient was significant and correctly signed. Higher oil meant a stronger Canadian dollar. Run across the 2016–2024 window, the coefficient became statistically non-significant. The relationship had dissolved. [6]
The one-year rolling correlation between weekly WTI changes and USD/CAD, which averaged approximately +0.4 from 2005 onward, has turned slightly positive in the inverted convention, meaning higher oil prices now weakly associate with a weaker Canadian dollar. [6] Scotiabank's Olivier Gervais has noted the link "has not completely disappeared" and "could re-emerge" if oil gains become demand-driven rather than supply-shock-driven, but no institutional analysis has found the correlation re-establishing significance with recent data.
A note on sourcing: Alberta Central is a financial institution, not a government body. This analysis sits at institutional tier, not preferred. The regression appendix is not independently peer-reviewed. No separate Bank of Canada paper examining the oil-CAD breakdown was located, though the BoC's foundational "The Turning Black Tide" working paper established the earlier positive relationship. [8]
Where the Revenue Goes
Alberta Central's analysis identified the mechanism: while oil exports are near record levels, a smaller share of revenues are being converted from USD to CAD because the revenue is not returning to the Canadian economy. [6]
Ownership structure is one documented channel. Statistics Canada data show that 36.5% of oil and gas assets are foreign-owned, more than double the economy-wide average of 14.7%. [4] At the company level, the concentration is sharper. Canada's four largest producers (Canadian Natural Resources, Cenovus, Imperial Oil, and Suncor) are approximately 73% foreign-owned and 60% American-owned, according to an analysis by Silas Xuereb published through Canadians for Tax Fairness and the Alberta Federation of Labour. Individual Canadian ownership ranges from approximately 8% at Imperial Oil, which is roughly 69.6% owned by ExxonMobil, to approximately 41% at Suncor. [12]
From 2021 to 2024, the report estimates the Big Four paid $58.4 billion to foreign shareholders, including $49.3 billion to American owners. Only $21.3 billion went to Canadian shareholders. Dividends rose to $8.4 billion per year; stock buybacks rose to $11.5 billion. Meanwhile, domestic capital investment fell from $27.9 billion per year in 2011–2014 to $15.9 billion in 2021–2024. The workforce contracted too: Canada's oil and gas production reached a record 8.4 million barrels of oil equivalent per day in 2024, up from under 6 million in the early 2010s, while the industry employed 30,000 fewer workers than in 2014. [12]
This report is advocacy-affiliated, and its ownership-by-country estimates carry stated uncertainty (nationality inferred from exchange-trading distribution; distributions assumed proportional to ownership). But the underlying data sources are robust: Compustat North America, Statistics Canada, and SEC 13-F filings. [12]
The preferred-tier anchor sits in Statistics Canada's balance of international payments. In Q1 2026, "profits earned by foreign direct investors on their assets in Canada, led by the energy and mining sector, increased more in the first quarter than those earned by Canadian direct investors on their assets abroad." The current account deficit widened by $6.2 billion to $7.2 billion, the 15th consecutive deficit. [3]
One critical gap: no Bank of Canada or Statistics Canada primary series directly measures the share of oil-export USD revenue that is converted to CAD versus retained in USD. The repatriation-flow estimates rest on Alberta Central's modelling from company financials. This is the largest sourcing gap in the article's spine.
The domestic retention must be stated honestly. Alberta's oil and gas royalty revenue rose to $19.6 billion per year during 2021–2023, up from $7.9 billion per year in 2011–2014. Nationally, the sector generated approximately $116 billion in combined taxes and royalties from 2022 to 2024, employing roughly 450,000 workers directly and indirectly. [13] The "Exporting Profits" report treats royalties as an intermediate cost by design, meaning its "$58.4 billion left" framing excludes significant domestic retention through royalties, taxes, wages, and operating costs. The revenue leak is real for the dividend and buyback channel. It is not the whole picture. What has changed is the marginal dollar: as production hits record levels and war-elevated prices push profits higher, the incremental value flows disproportionately to foreign shareholders rather than into domestic reinvestment.
One complicating factor is the Trans Mountain Expansion, operational since May 2024, which narrowed the WCS-WTI differential and increased realized revenue for Canadian producers. TMX does not break the thesis: it increases the size of the revenue pool, but the distribution question remains. Under the current ownership structure, the additional gross revenue from improved pipeline access flows through the same shareholder-return channels.
The second compounding mechanism is monetary. The Bank of Canada held its policy rate at 2.25% for a fifth consecutive decision on June 10, 2026. [7] The U.S. Federal Reserve, under Chair Kevin Warsh, held at 3.50–3.75% on June 17 and removed easing language from its statement, with multiple FOMC members signalling possible rate increases. [11] The resulting 125-to-150-basis-point differential in the U.S.'s favour is a structural drag on CAD, pulling capital toward dollar-denominated assets. The Bank of Canada is constrained: cutting further risks accelerating capital outflows and import-price inflation, while hiking is difficult with business investment contracting and GDP growth dependent on a single sector.
The Norway Question
If foreign ownership explains the oil-currency decoupling, Norway should be the counterexample. It is not.
Equinor, Norway's largest oil and gas company, is 67% owned by the Norwegian state, managed by the Ministry of Trade, Industry and Fisheries. [15] Norway's Government Pension Fund Global held approximately NOK 21,300 billion at the end of 2025, equivalent to more than US$2 trillion, roughly four times Norway's GDP. [16]
Yet the Norwegian krone has also decoupled from oil and been persistently weak since approximately 2017. Research by Benedictow and Hammersland at Statistics Norway, published in Economic Modelling in 2023, attributed this to a transition-risk premium: declining petroleum share of exports, the green shift, and fading oil-sector importance in the broader economy. The standard oil-price-and-rate model could not explain the krone's weakness. [14]
This is the strongest counter-evidence against a purely ownership-driven explanation. Foreign ownership is not necessary for the petro-currency model to break. Shared global drivers affect all commodity currencies: rate differentials, USD structural strength amplified by safe-haven flows during the Iran war, and the energy-transition risk premium that discounts the long-term value of fossil fuel output. The Australian dollar has been range-bound near US$0.69–0.71 despite commodity strength. [14]
But the comparison reveals something the currency data alone cannot. Norway's sovereign wealth fund reduces domestic absorption of petroleum revenue by investing it abroad, a design commonly understood as helping limit Dutch-disease pressures, though its formal purpose is long-term saving and intergenerational management of petroleum wealth, not direct currency targeting. [16] Canada has no equivalent mechanism. In both countries, oil revenue leaves the domestic economy and the currency weakens. The structural lesson is the same: oil revenue that is not converted to domestic currency does not strengthen it, regardless of the mechanism of exit. The difference is what happens to the value. Norway owns the proceeds in a fund worth four times its GDP. In Canada, a larger share of the shareholder-return channel flows to foreign owners.
Three Fronts
The three-front decline makes this harder to dismiss as only a strong-USD story. If the driver were purely U.S. dollar strength, the loonie would be more likely to hold against other currencies. It is not.
At end of June 2026, the CAD traded at approximately US$0.705 (USD/CAD ~1.42), near a 14-month low. Against the euro, it fell to approximately 0.616, down roughly 3.35% from its March high. Against the Chinese yuan, it dropped to approximately 4.78, down from 5.15 in late January. [19] National Bank Financial described the loonie as "the weakest reserve currency in recent weeks."
For Canadian households, this matters through what they buy. Canada is a net importer of consumer goods ($157 billion in 2024), motor vehicles and parts ($141.6 billion), and industrial machinery and electronics. The United States accounts for 58.8% of Canadian imports, with Asia at approximately 25.5% and Europe at 14.5%. [5] Canada is a large net exporter in energy products, agriculture, and forestry, and runs an $81.6 billion goods surplus with the United States. But in nearly every finished-goods category, the trade balance runs the other way. [5]
Bank of Canada research has estimated that a 10% nominal depreciation associates with approximately a 4.8% rise in local-currency import prices, with overall import-price pass-through of roughly 59%. [9] [10] The pass-through to consumer prices is, in the BoC's characterization, "observed relatively quickly but quite modest." But a currency falling against all three major trading partners simultaneously compounds the effect across the entire import basket, not just the USD-denominated portion.
A weaker CAD does improve competitiveness for Canadian manufacturers and non-energy exporters, a partial offset this analysis does not fully quantify. But the scale of that benefit depends on the capacity of non-energy sectors to respond, and business capital investment has declined for five consecutive quarters. [2]
The Industrial Product Price Index rose 13.6% year-over-year in May 2026, though much of that surge reflects domestically produced energy (diesel up 61.0%, gasoline up 47.9%) rather than purely imported consumer goods. [18] The cost channel is real, but it is not clean enough to attribute entirely to currency depreciation. Energy prices, the Iran war, and exchange rate weakness all feed into the same price environment. What is clear is that a petro-economy whose currency no longer responds to oil prices is a structure that raises costs on both sides. Energy costs go up from the commodity exposure. Import costs go up because the currency does not compensate.
The $90 Billion Question
The Financial Times projected that Canadian oil producers stand to receive a C$90 billion windfall from the Iran war, based on modelling by Enverus, a Houston-based analytics firm. The projection assumes oil prices remain near war-elevated levels (WTI approximately $98 versus approximately $67 pre-war) for a sustained period. The Energy Mix calculated that prices would need to hold approximately $40 per barrel above baseline for roughly 425 days to reach that figure. The Canadian Centre for Policy Alternatives independently modelled a similar $90 billion over 12 months. [17]
This is a conditional projection, not a realized figure. It must be treated as such.
But the direction it points is structural. Under the current ownership configuration, the majority of any windfall would flow to foreign shareholders. Big Four executives confirmed in April 2026 that war-driven profits would be directed to shareholder returns, not additional capital expenditure. [12] Exports of refined petroleum have already surged 69.7% year-over-year. Crude oil exports to Asia and Europe jumped 46.6%. Energy products led Q1 2026 export growth at 16.1%. [2]
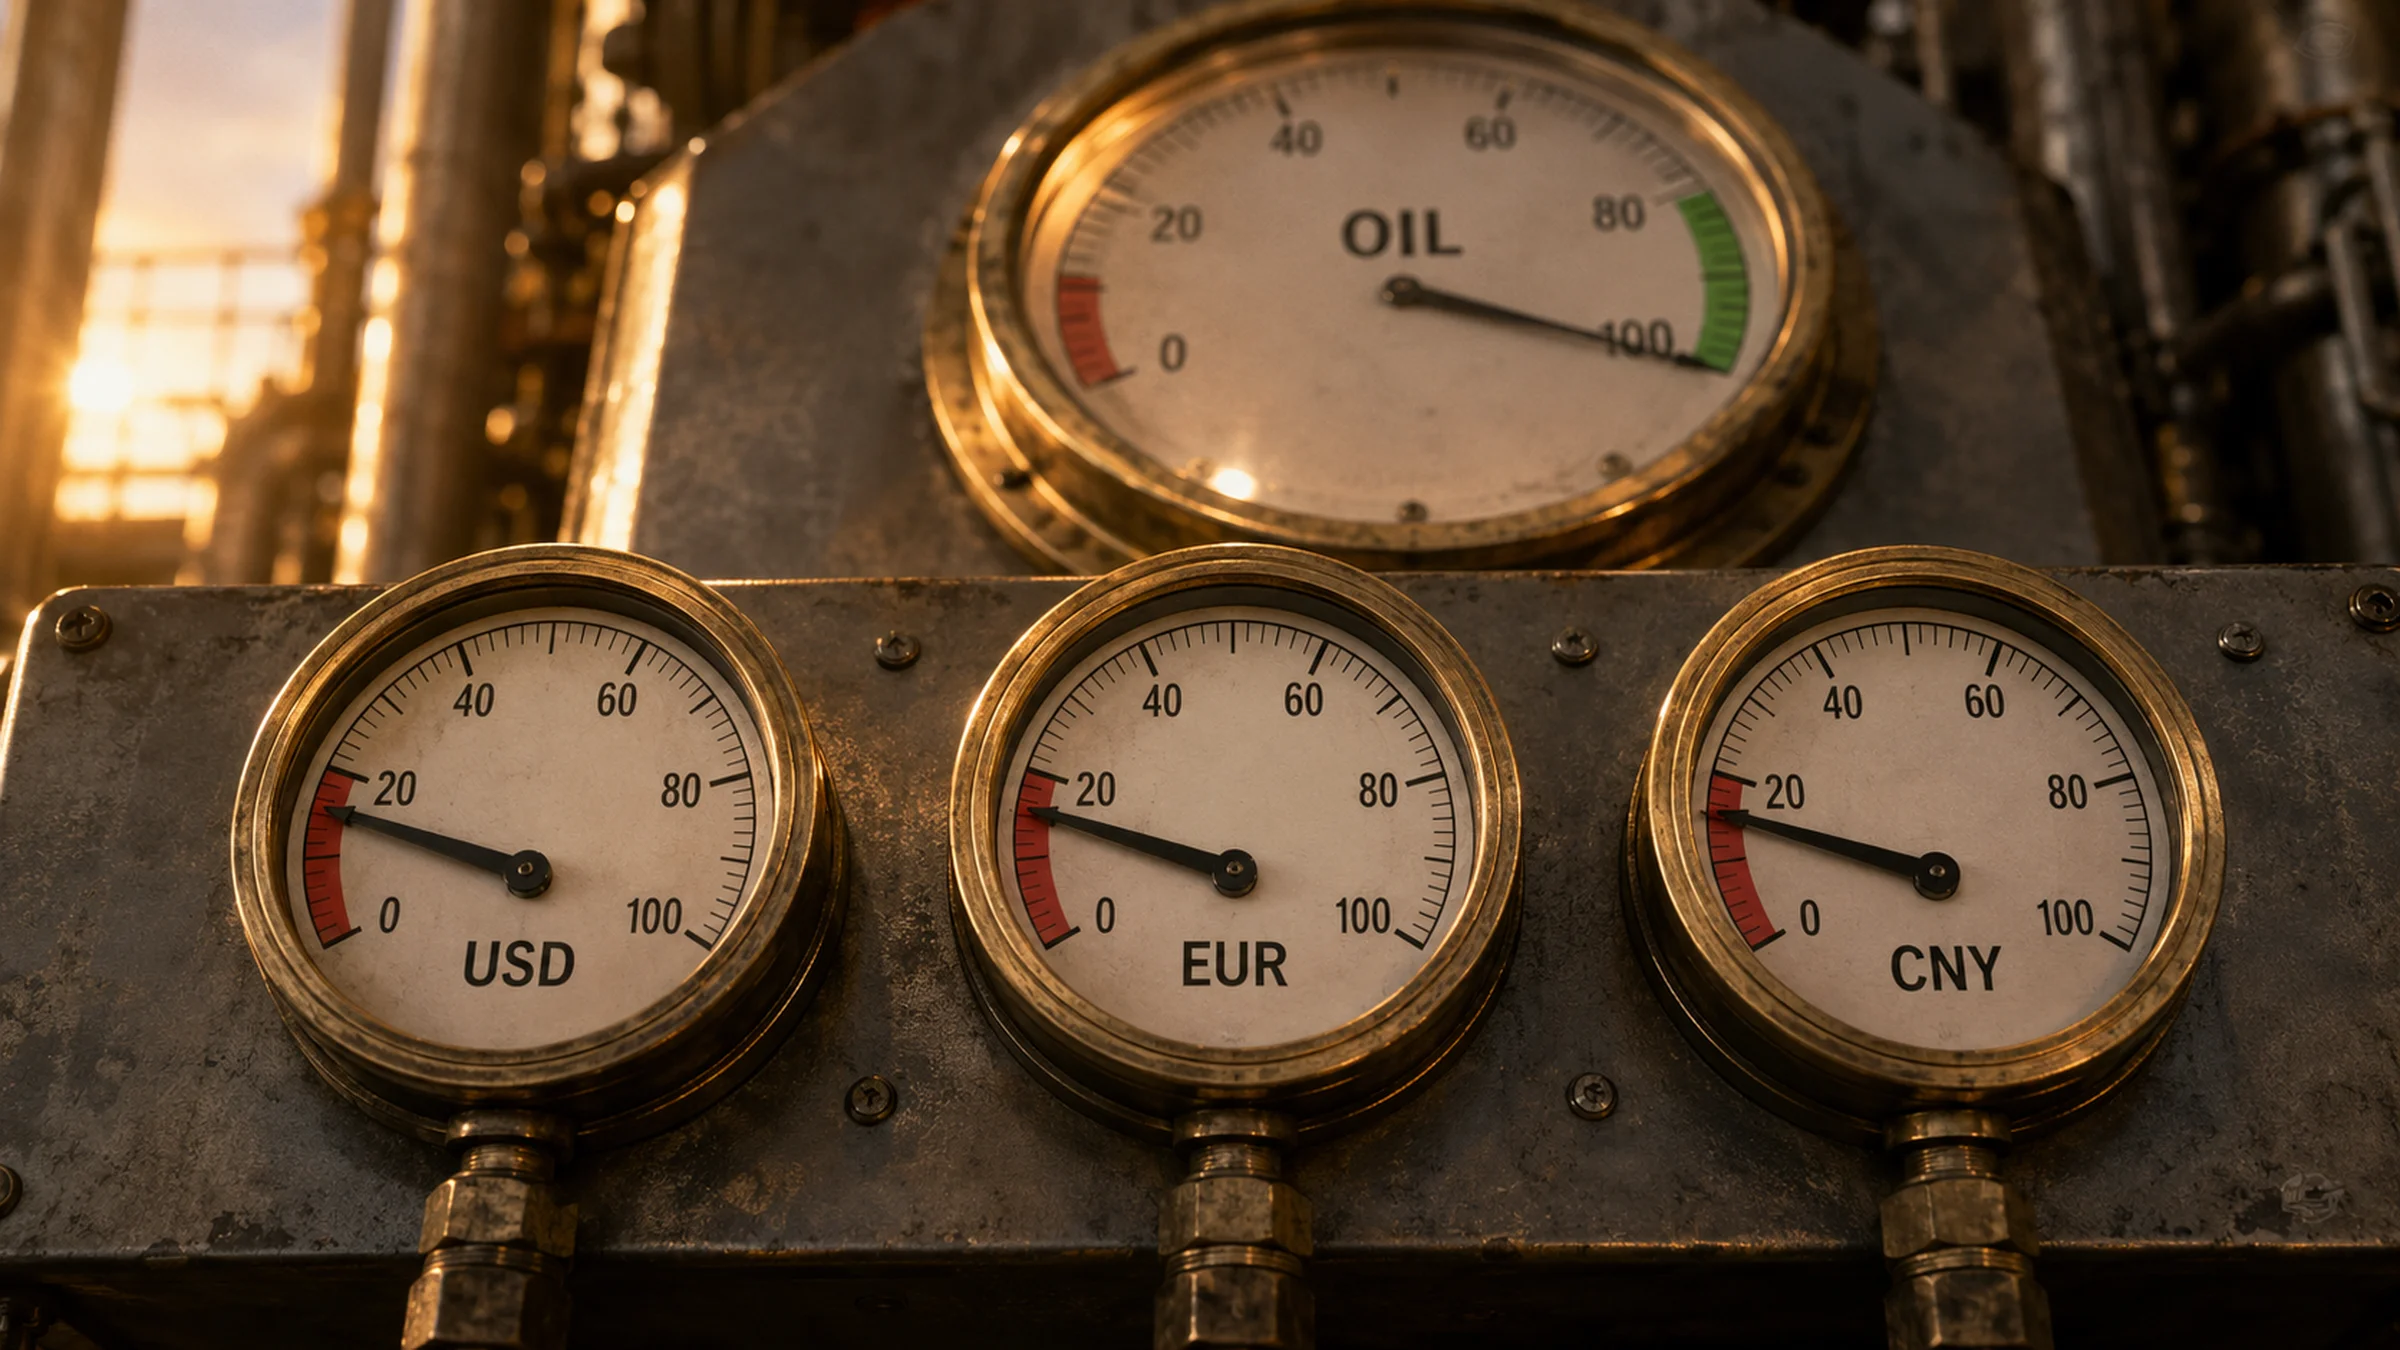
The GDP headline will improve. Canada's record oil output, flowing through a foreign-owned production base to a global market priced in USD, generates economic activity that Statistics Canada measures. But the structural position that determines whether that activity strengthens the currency or supports household purchasing power has not changed. The correlation broke. The ownership structure routes profits abroad. The rate differential pulls capital south. And the loonie weakens against three major currencies at once while the oil gauge reads high.